How I am reversing my diabetes thanks to my data science skills
Keith McNulty
Expert and Author in Applied Mathematics, Data Science, Statistics and Psychometrics. Find me on LinkedIn or Twitter or drkeithmcnulty.com
This is an unusually personal post, but one I feel I have to write about to encourage others. Early in 2020, I suspected that I might have issues with my blood glucose levels. I bought one of those inexpensive prick test devices and indeed my readings were higher than they should be. I contacted my doctor to see about a more formal test, but because of the COVID pandemic I was put off until later in the year.
Nevertheless I embarked on a process to reduce my weight. I was told that weight loss is the first step in managing diabetes, and my BMI was a little over the recommended healthy maximum of 25. So I cut out sweet food, tried to moderate my overall intake, and did a lot of walking and cycling. Within a couple of months I was down 7kg (about 15 pounds). At that point I declared a small victory, tapered off the regime and focused on maintaining my new weight.
Being diagnosed with Type 2 Diabetes
When I finally got into the doctor later in the year I had a test of my HbA1c — a measure of average blood sugar levels over the past three months . In the UK, a HbA1C level of 41 or below is considered healthy, 42–47 is considered ‘at risk of Type 2 diabetes’, and 48 or above is considered diabetic. My score was 49. Quite honestly if I had come in earlier in the year it probably would have been higher than that. While not overly surprised by the diagnosis — I had been doing prick tests on and off, I have a sedentary job and I have a family history of T2 diabetes— I told the nurse that I would like to try to turn it around naturally and not take medication. She gave me some further advice on diet and left me to it.
Three months ago, I went back for a follow up HbA1c and it was 48. Still diabetic, but only just. This was not the improvement I had hoped for — my goal was to get back into the healthy range below 42. I explained to the nurse that I was trying to make the right choices about eating, but clearly I had more to do — I just didn’t know what.
The nurse knew what I did for a living and quickly realized that what I needed was data to motivate me. She recommended I purchase a continuous glucose monitor (CGM) — a neat device which you wear on your arm or stomach for 14 days and which continuously tests your glucose levels in your interstitial fluid underneath your skin. I was so excited about this that I went right out and bought two of these devices so that I could monitor my blood sugars continuously for a month. During this period I recorded estimates of my carbohydrate and fat intake in each meal or snack, and I also recorded when I drank alcohol (the only alcohol I drink is wine so I recorded each glass that I drank). I did not get around to recording my protein intake, although I probably should have.
Analyzing the data
Immediately upon wearing this device and viewing the data through an app on my phone, I could see what foods were spiking my glucose level and was able to very quickly adjust to prevent these spikes. So the impact was instant. But I was particularly interested in how to think about three things in my diet: carbs, fat and alcohol. After wearing the devices for a month I pulled my data down and analyzed it in R.
First I looked at my general glucose levels (in mmol/L) by hour over the entire month. For reference, a healthy person should be in the mid-5’s before a meal and should be under 8 within 1.5–2 hours after a meal.

You can see some of the occasional crazy peaks that I hit when learning about my diet through this device, but the smooth fit line shows that the learning has indeed helped me keep my glucose down to something more like healthy levels.
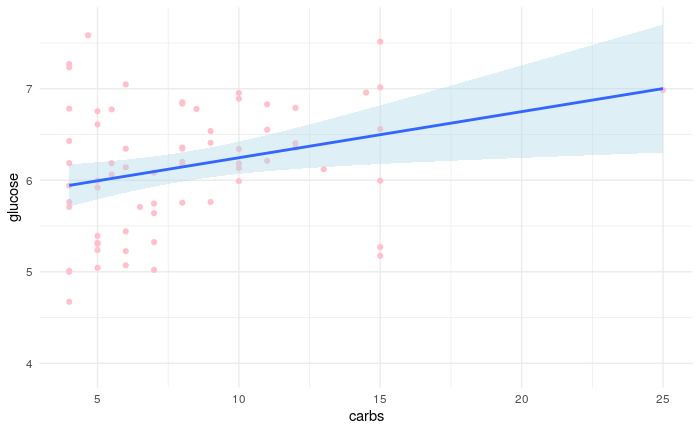
Even though I was trying to keep my carb intake low, I was also interested in verifying that there was a direct relationship between my carb intake and my average glucose levels within specified time periods. So I grouped the data into 6-hourly groups, and calculated my total carb intake in grams and related it to my average glucose levels during those 6-hour periods. Despite the relatively small number of observations there was a positive trend, telling me that even at my reduced levels I had to maintain care in my carb intake.
I took the same approach with my fat intake and saw that there was no real relationship between this and my glucose levels.

Finally
I was interested in how my alcohol intake might affect my glucose
levels. I was aware that wine is generally quite low in carbohydrates,
but that alcohol puts your liver to work over extended periods of time.
So for this analysis I split the day into 2 twelve hour periods, and
created a lag_wine variable which
was equal to 1 if I drank wine in the previous 12 hour period and 0
otherwise. I found that my blood glucose was lower in periods after I
had drank wine. This suggested to me that drinking wine can keep your
liver busy for extended periods of time and this can result in lower
blood glucose during these periods. However I am not using this as a
reason to overindulge — the negative, longer-term effects of alcohol on
other aspects of health are well researched and documented, and other
alcoholic drinks like beer can be very high in carbs.

Running some models
I didn’t have a huge amount of data but I thought it was worth trying out some statistical models on data I had transformed for the previous analysis. First I ran a linear model to understand the combined effects of carbs, fat and lagged wine intake on glucose levels over 12 hour periods:

We can see a reasonably OK fitting model has been generated showing a significant positive effect of carb intake on glucose levels, no significant impact of fat intake and a near-significant negative effect of wine consumption.
I
was also interested in whether there was a certain level of carb intake
that gave me a higher probability of high glucose readings in the 6
hour interval data (which I defined as readings over 9 mmol/L). I ran
three binomial logistic regression models on the high
glucose outcome with different cutoff points for carb intake at 6g, 10g
and 15g and found that 10g had the most significant result.

The outcome
I am motivated by data and being able to see and analyze my statistics in this way has been transformative to my health. I have adopted a cardinal rule to keep my carb intake below 10g per meal, my latest HbA1c estimates have me at a very healthy level of 34, and my weight levels have fallen into a much more healthy range. Of course, now that I have found this route out of Type 2 diabetes, I have to maintain it. I will always be at risk of slipping back again if I’m not proactive and careful with my health and lifestyle. But I am thankful to technology and to my data science skills for taking me to where I am. I hope this post might motivate others to consider how data can be a great tool in managing your health.